
In this Issue…
A Look Into the Markets
Mortgage Market Guide Candlestick Chart
Economic Calendar for the Week of February 6
A Look Into the Markets
This past week the Federal Reserve paused a hike of rates for the fourth consecutive time. Interest rates ticked down to the best levels in nearly a month. Let’s discuss what happened and look at the events to watch next week.
Sustainably Toward 2%
As mentioned above, the Federal Reserve did not hike rates. In fact, they removed any reference to future hikes in their Policy Statement. So, the good news is that the next move will indeed be a rate cut, the bad news is when.
Fed Chair Powell said he wants to have greater confidence that inflation is moving “sustainably towards 2%”. He repeated this phrase several times in his press conference. What was unclear to the market is the measure the Fed is looking at to determine if inflation is moving sustainably towards 2%.
A couple of weeks ago the Fed’s “favored gauge” of inflation, the Core Personal Consumption Expenditure (PCE) Index came in at 2.9%, the lowest level in years. Powell made it clear, he needs to see more data and confirmation that inflation is still moving lower before the Fed considers rate cuts.
March Rate Cut-Off Table
After the Fed’s statement and press conference, the chance of a rate cut in March went from a probability of 60% to just 30%. Even Fed Chair Powell said a chance of a rate cut in March is not his base case. So now we must look to the April/May meeting for a potential rate cut, unless of course, surprising data comes in to support one sooner.
Good News is Bad News
In addition to the Fed Meeting, which helped lower rates, there was a slew of bad economic news that also helped support bond prices and push rates lower.
Additionally, the ADP Report which shows the number of private payrolls created in the economy, came in at just over 100,000 job creations for December. This was well below expectations and a downright weak print. Adding to the inflation story was the employment cost index, another gauge the Fed likes to watch, which showed inflation is indeed moving lower.
Consumer Remains Confident
Despite the elevated rates and some of the bad news in the labor market, the consumer remains confident. Consumer Confidence came out last Tuesday and was reported to be the highest level in three years highlighting that consumers feel there may be better days ahead…lower inflation and lower rates.
4%
As we discussed in previous issues, 4% is a key level to track on the 10-year Note. Why? If rates stay above 4%, then 4% is about as good as rates can get. This means mortgage rates can’t improve further. The opposite is true. There is some good news here as the 10-year Note dipped beneath 4% for the first time in several weeks in response to the Fed meeting. Remaining at or beneath current levels could very well lead to lower rates ahead, hence the renewed optimism amongst consumers.
Home Activity is Responding
Every time we have seen a downtick in interest rates, we see a flurry of activity in the housing market. This time is no different. With the Fed’s next move being a rate cut and Spring quickly approaching, things may end up being better than expected for housing. Just a few short months ago in October rates were 8% and the housing market was frozen. That is not the case today.
Bottom line: Markets changed quickly back in October, and no one was expecting to see interest rates decline like they have in such a short period. We now know the Fed’s next move will be a cut, and it’s coming sooner rather than later. With life wanting to move on and pent-up demand in housing, we should expect better days in the months ahead.
Looking Ahead: Next week is all about debt. The economic calendar is light on reports but the Treasury will sell $121 billion in 3,10 and 30-yr bonds. If the auctions go well, rates could improve. If they don’t, interest rates could spike higher. Through it all, expect Fed officials to offer their thoughts on the economy and future rate cuts.
Mortgage Market Guide Candlestick Chart
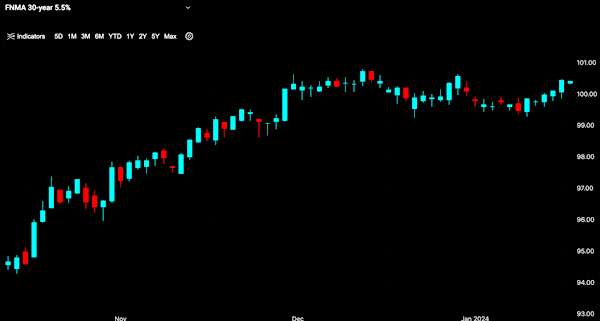
Mortgage bond prices determine home loan rates. The chart below is a one-year view of the Fannie Mae 30-year 5.5% coupon, where currently closed loans are being packaged. As prices move higher, rates decline, and vice versa.
On the far-right side of the chart, you can see how prices have gone sideways over the last 6 weeks. We shall soon find out if rates will resume their move lower or have they bottomed in the near-term.
Chart: Fannie Mae 30-Year 5.5% Coupon (Friday, February 2, 2024)
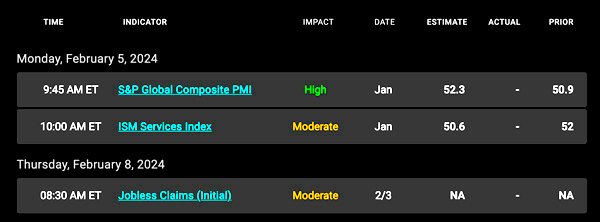
Economic Calendar for the Week of February 5 – 9
The material contained in this newsletter has been prepared by an independent third-party provider. The content is provided for use by real estate, financial services and other professionals only and is not intended for consumer distribution. The material provided is for informational and educational purposes only and should not be construed as investment and/or mortgage advice. Although the material is deemed to be accurate and reliable, there is no guarantee it is without errors.
As your mortgage professional, I am sending you the WEEKLY Newsletter because I am committed to keeping you updated on the economic events that impact interest rates and how they may affect you.
Mortgage Market Guide, LLC is the copyright owner or licensee of the content and/or information in this email, unless otherwise indicated. Mortgage Market Guide, LLC does not grant to you a license to any content, features or materials in this email. You may not distribute, download, or save a copy of any of the content or screens except as otherwise provided in our Terms and Conditions of Membership, for any purpose.

We are ready to help you find the best possible mortgage solution for your situation. Contact Sheila Siegel at Synergy Financial Group today.


