
n this Issue…
A Look Into the Markets
Mortgage Market Guide Candlestick Chart
Economic Calendar for the Week of October 17, 2022
A Look Into the Markets
This past week, we witnessed the highest consumer inflation reading in 40 years and the markets responded. Let’s walk through what happened and investigate the week ahead.
Consumer Prices Still Rising
On Thursday, the Personal Consumption Index (CPI) was reported at 8.2%, which was higher than expectations. What is of bigger concern is the month over month rate of inflation was reported at 0.4%…double expectations of 0.2%. The monthly increase is what the Federal Reserve watches closely to see if inflation is peaking.
Shelter makes up 40% of consumer inflation and that component rose 6.6% year over year. For inflation to come down to the Fed’s target of 2%, we will need to see rents come down and this will take some time.
Here’s what we learned with the high inflation reading. First, the Federal Reserve is now very likely to increase the Fed Funds Rate by .75%. It also means they will continue to talk tough and maintain a position of higher for longer for rates.
The Market Reaction
It’s a good time to be reminded that the Fed only controls the Fed Funds Rates, which is a short-term, overnight rate. Long-term rates, like the 10-yr Note will only go up IF the economy can absorb the higher rates. Despite rates spiking in response to the inflation numbers, the 10-yr Note yield was stopped at 4%. This is because the markets are forward looking and sensing slower economic conditions ahead will lower inflation.
Fed Rate Hike Impact
Another reason long-term rates may be approaching their peak is to consider why the Fed is hiking rates to begin with. The Fed is hiking rates to lower inflation, slow demand, create unemployment and lower asset prices. All these things are beneficial to long-term rates.
Looking Ahead
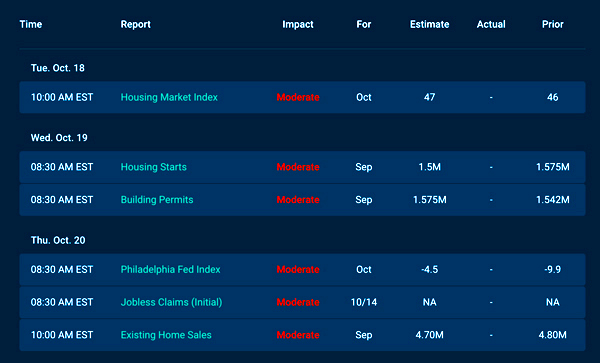
The economic calendar is lean here at home with just housing on the docket. There will be plenty of Fed speak and central bank activity around the globe to track as well as corporate earnings being reported.
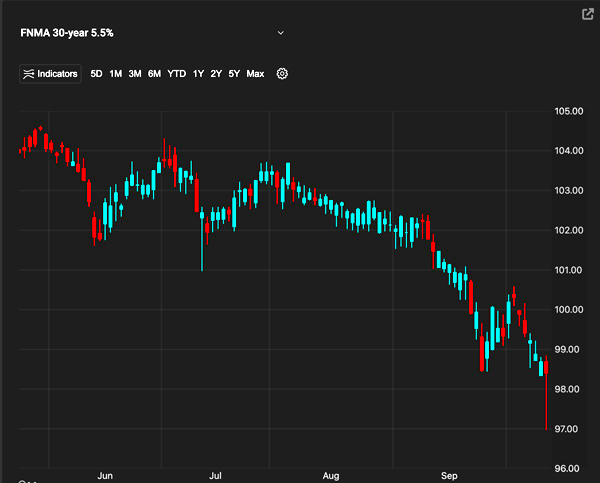
Mortgage Market Guide Candlestick Chart
Mortgage-backed security (MBS) prices determine home loan rates. The chart below is a one-year view of the Fannie Mae 30-year 5.5% coupon, where currently closed loans are being packaged. As prices go higher, rates move lower and vice versa.
Prices hover just above a key floor of support which hopefully holds prices higher. If the bond falls beneath this nearby support level, home loan rates will move another leg higher.
Chart: Fannie Mae 30-Year 5.5% Coupon (Friday, October 14, 2022)
Economic Calendar for the Week of October 17 – 21
The material contained in this newsletter has been prepared by an independent third-party provider. The content is provided for use by real estate, financial services and other professionals only and is not intended for consumer distribution. The material provided is for informational and educational purposes only and should not be construed as investment and/or mortgage advice. Although the material is deemed to be accurate and reliable, there is no guarantee it is without errors.
As your mortgage professional, I am sending you the WEEKLY Newsletter because I am committed to keeping you updated on the economic events that impact interest rates and how they may affect you.
Mortgage Market Guide, LLC is the copyright owner or licensee of the content and/or information in this email, unless otherwise indicated. Mortgage Market Guide, LLC does not grant to you a license to any content, features or materials in this email. You may not distribute, download, or save a copy of any of the content or screens except as otherwise provided in our Terms and Conditions of Membership, for any purpose.

We are ready to help you find the best possible mortgage solution for your situation. Contact Sheila Siegel at Synergy Financial Group today.


